Measuring crowd movement dynamics and choices
In the past decennia, sensing technologies have made large leaps forward. Consequently, the way in which we gather information about the choice behaviour and movement dynamics of crowds, the latency before we can access this information at a central location, and the way in which we can analyse the incoming information transformed completely. Were in 1990, manual counting and stop-motion videos were the only ways to study crowd movements, now we have a wide variety of options available to measure the dynamics of crowds.
Each sensing technology (hereafter called monitoring technique) have particular characteristics, which have consequences for the way in which we can use them in the management and analysis of crowd movements. In this section, we will discuss the main crowd monitoring methods, and discuss the practical conditions that apply to the monitoring of crowds will briefly be touched upon.
Given that the developments of sensor systems continue at a rapid pace, we do not deem it fitting to discuss them at product level. Instead, we will discuss their capabilities at a more generic level, and study the general characteristics of each monitoring technique. Moreover, please note that the applicability of monitoring techniques is very scenario-specific. Consequently, this section only serves as a first guideline to select a crowd monitoring technique. Site research is always necessary to make an informed choice, where practical considerations and the conditions at the scene should determine which monitoring methodology best fits the purpose.
Before going into the various monitoring techniques, first the characteristics of the information one can derive are discussed. The next section discusses the prevailing monitoring technologies. The last section provides an overview of the most essential characteristics.
Characteristics of the information
Pedestrians are by nature discrete particles that move fluently through a space. To optimally manage pedestrian spaces we would like to be continuously informed about the state of the entire infrastructure, and as such know where each pedestrian resides within the infrastructure. Yet, with the current state of affairs, this seems to be something for the future.
Currently, most sensors are still very expensive (especially installation thereof) and have to many risks w.r.t. the infringement of the right to privacy, to allow for their full-scale deployment. So, we should carefully think about what management information we need, and what monitoring technique we should use to derive this information.
Types of information
Information about a pedestrian flow can take on various shapes, depending on the monitoring technique. There are monitoring technologies that only generate insights about one specific location or a small area (location-bound techniques). For instance, most camera systems can only analyse what happens within their field of view. Other measurement techniques can collect insights featuring large continuous areas (area-bound techniques).
Besides that, there are monitoring techniques that are able to derive the location of the transmitter of the insights (location specific). The X- and Y-coordinates of the transmitter are known to the organisation. Applications that transmit GPS coordinates of their users are an example of location specific information. Other monitoring techniques can only identify that a certain transmitter was present within an area (not location specific). Bluetooth and GSM services are an example of this type of information. These systems know which enabled devices are within reach of an antenna, but cannot derive the coordinates of the transmitter based on their information alone (note: if the raw information of multiple antenna’s is combined, geo-location and tracking are possible).
Another difference between monitoring techniques, is the manner in which the data is gathered. A pedestrian can willingly provide information about its location or state (information push). Twitter is a nice example of information push. Yet, an individual can also provide its location and state information to an organisation, because they are specifically asked to do so (information pull). Most Bluetooth systems fall in this category.
The time interval by which the information is scraped and transmitted is another distinction between the monitoring techniques. A camera system provides continuous information to the management organisation (continuous), while most other applications transmit their information at specific points in time (discrete).
Lastly, there are systems that are capable of identifying the transmitter of the information. Based on a personal identification number, the data send by one transmitter can be linked (enables tracking). By means of tracking, more information on the movement dynamics of the transmitter can be derived (e.g. speeds, route splits). A large number of monitoring methods does not generate enough information to make tracking possible. Besides that, there are quite some systems where tracking is possible, but the computational load is too heavy to use them in real-time.
Amount of data
The amount of data that is generated by a system is depending on the coverage of the monitoring method. A camera system provides insights about all individuals that are within the field of view. Consequently, within the field of view a camera has 100% coverage. A Wi-Fi sensor depends heavily on the amount of Wi-Fi enabled smartphones in an area that is looking for a signal. As a result, the coverage of a Wi-Fi sensor is a lot lower, often as limited as 20%.
Available monitoring techniques
In the previous section, a few monitoring techniques have already been mentioned. In the remainder of this chapter, we will also present a few other ones. For each technique, we will briefly describe its working mechanism, the current applications, the type and amount of data that is derived and the possibilities to use the technique for crowd analytics and monitoring purposes.
Human Counting systems
The simplest method to determine the amount of pedestrians is an area of at a cross-section is to deploy staff members with a counter. For every person that passes, the staff member adds 1 to the total. At the end of every counting period, the person records the total and resets the total count to 0. A slightly other technique is used to identify the crowding on large squares. In this case, photos are taken from a large square from a high vantage point. This photo is divided into regions. The random number of pedestrians in a set number of the cells is counted completely. Accordingly, the average number of pedestrians in each cells is computed and multiplied by the number of cells in the image.
Human counters and crowd watchers are often both physically present at the location that they are analysing. Consequently, they are also able to perform other small tasks on the side, such as studying the overall crowd dynamics for self-organisation phenomena or tasting the atmosphere. They can also serve as a probe in the crowd.
Video surveillance (or CCTV)
Another type of digital sensor is a camera. The video feed of the camera is in real-time transmitted to a central location (often the Operational Control Centre). Here, specialists watch the feed as it comes in, and analyse its content on the fly. These specialists are trained to spot crowd behaviours that are out of the ordinary, such as fights, people moving into the flow, turbulence, suspicious movements, and weird objects. Often they transfer their analyses in via spoken word to their superiors.
Next to ‘normal’ camera systems, also specialist cameras can be added at the moments one is expecting large crowds. Statcameras and helicopters equipped with cameras are often used by crowd professionals to get a good overview of the crowds and dynamics that are spread across vast areas. These cameras are placed at very high locations (20-100m height) to ensure a large field of view.
Computer vision systems (incl. camera)
This third type of digital sensor is in essence a combination of a camera and a set of computer vision algorithms. In real-time, the video feed of the camera is analysed by means of algorithms at the camera (distributed computing) or at a central location (cloud service – e.g. AWS). These results are, accordingly, transmitted (wirelessly) to the server and visualized by a crowd monitoring dashboard. The video feed itself is often erased as soon as it is analysed and is not stored in the analysis unit, nor in the cloud service. Only the numeric outputs of the algorithm are stored.
Computer vision systems are undergoing rapid developments. Until 2018, crowd analytics by means of cameras was difficult, as the computational load was too heavy to allow for real-time applications. As you will see in the case studies, the capabilities of computer vision systems currently include, amongst other things, the identification of speed, density, directional flow counts, location and distances between individuals, the mood of individuals, bags, unwanted objects, undesirable movements. All of which can be performed in at a near to real-time pace. Artificial intelligence is expected to further shape this way of performing crowd analytics.
Most computer vision systems are capable of determining trajectories of all individuals in the field of view. This allows for the derivation of the macroscopic traffic flow variables flow, density and walking speed. As such, based on this information, the fundamental diagram of an infrastructure can be determined.
Please note, it depends on the exact computer vision algorithms you use, what variables a computer vision system can detect, how specific measurements are and how reliable the result is. Especially under high-density conditions, very abrupt moving crowds (turbulence) and bad weather conditions, computer vision systems often have difficulties detecting all pedestrians. In those instances, occluded pedestrians are not counted; overlapping pedestrians are often counted as one or multiple times because the trajectories are broken due to rapid speed and directional changes. Moreover, umbrellas, trees and bad light conditions (darkness and very sunny conditions) are known to disturb the validity computer vision systems.
Wi-Fi / Bluetooth sensors
Each Wi-Fi/Bluetooth enabled device transmits messages to communicate with other devices and cell broadcasting towers, which contain identification information (a MAC-address) (Danalet et al. 2014; Yoshimura et al. 2014). This address can be used to determine how many unique devices are present at a certain location. If we assume that each person carries one Wi-Fi enabled device, the number of unique devices is a proxy for the number of unique visitors of a location. In addition, when comparing the lists of unique devices of two locations, one can determine how many devices moved from one location to the next. This allows us to derive walking speeds and route splits in a sensor network. In some case, when sensors are optimally placed, triangulation can be used to determine the location of a device based on the Bluetooth or Wi-Fi signal. Yet, the accuracy of the triangulation is often not very good, as the signal strength differs per mobile phone type.
The MAC-address, which is part of this message, is very privacy-sensitive information, as it can be used to identify one particular Wi-Fi enabled device that belongs to one particular person. Therefore, it is important to pay specific attention to the need for this type of data and balance this against the right to privacy of citizens. Often, you will see that other crowd monitoring techniques can deliver similar information, while providing more privacy protection.
As a general working principle, Wi-Fi/Bluetooth sensor data should ALWAYS be anonymized (not pseudonymised, i.e. hashed and truncated) at the source, and deleted as soon as the anonymized data is analysed by the crowd monitoring system. This way, we can ensure that a device (and the pedestrian) is really ‘forgotten’ as soon as their information becomes irrelevant, while retaining the important properties of the data.
Besides that, even though almost every person is carrying at least one smartphone at all times, this does not necessarily mean that all phones are connecting to the nearest Wi-Fi sensor. Often Bluetooth and Wi-Fi, or even the entire phone, are shutdown to save battery. Especially amongst older generations, the assumption of one signal is one person might be severely flawed. Therefore, it is almost impossible to use one static translation ratio between the number of signals and visitors. Calibration of the Wi-Fi/Bluetooth signals is always necessary to determine the exact translation ratio.
Location information (and GPS trackers)
In recent years, the functionality of the smartphone has increased manifold. In parallel with the increasing smartphone capabilities and battery capacity, also the number and sophistication of smartphone applications is skyrocketing.
At the moment, a number of smartphone applications make use of the GPS tracker inside your phone to track your position in order to provide you with the latest information regarding activities you are currently undertaking. Depending on the application, this information can also be used by third parties for crowd management purposes.
Given that GPS data is privacy-sensitive, stringent privacy-protection protocols need to be applied to scrape and analyse GPS traces. Explicit opt-in permission from users, stringent anonymization protocols, high-end database security and tight database cleaning procedures are advised.
RFID – Radio-Frequency Identification (RFID)
RFID works as follows. At a given location, a pedestrian is handed a RFID tag, which looks like a carton card, a small plastic box or a wearable. The pedestrians are asked to go about their business while carrying the RFID tag for a certain period. During this period, strategically placed RFID sensors can sense the presence of the RFID tag whenever the tag is in the sensor’s vicinity. The time stamps and identifier information of the comprehensive RFID sensor network can be used to track the movements of the pedestrians that walk around with a tag. Whenever the pedestrian does not want to be tracked anymore, it throws away the RFID tag, after which the RFID sensors cannot track the movements of the person.
RFID tags are often used during sports events, such as marathons, ice skating and cycling, to track the progress of participants. Besides that, RFID tags are also increasingly used as a payment or identification system at large-scale events. Lastly, RFID can also be used to track the movements of individuals through a discrete sensor network. This allows the crowd managers to determine the global routing of pedestrians within this system.
One main advantage of the tracking of RFID tags over the tracking of Wi-Fi enabled devices is that the person who carries the tag has the ownership of its own data. The person has to accept the tag, can choose when to carry it around and can choose to throw it away. Consequently, only willing pedestrians provide the information they want to provide and pedestrians that are want to be ‘forgotten’ cannot be tracked.
Radar
Since a few years, also radar can be used to detect pedestrians. This sensor sends out radio waves and listens to reflected echoes from obstacles in the surroundings of the sensor. From the echo, information on the size, direction, distance, height and speed of the object can be deduced. In general, radar is very privacy preserving, as it only detects that there is a moving object with the properties of a pedestrian (high, size, speed), but it has no way to identify who that object actually is.
Radar is known to be especially good in detecting the number of pedestrians in low-density scenarios. In high-density scenarios, occlusion and overlap can cause radar sensors to misjudge the number of pedestrians they see.
Social media
The majority of the monitoring techniques describe above are especially capable of determining the activity choice, route choice and operational movement dynamics of pedestrians. These techniques give insight into the dynamics of public spaces, but not in the rationale behind the choices, not the sentiment of the pedestrians.
Social media, such as Twitter, Facebook, Instagram, WhatsApp and SnapChat, are digital platforms where these rationale and sentiment are publically expressed. These platforms are increasingly used, and most of them are easily accessible on the latest smartphones. Various studies show that people also make use of these services while they are on the move. Consequently, it is possible to use the messages on social media platforms to determine the reigning sentiment in the crowd. In rare cases, where geo-location information is provided with the messages, also traffic flow variables can be derived. Yet, this becomes increasingly rare, as most youngsters disable their geo-location information.
Please note, the adoption of social media platforms is not uniform across the population. Consequently, not everything will show on social media, nor will social media always provide a correct analysis on the situation (willful or unwilling actions of misinformation). Therefore, social media analytics are especially usefull to provide a preliminary analysis of the state of affairs or as part of a comprehensive analysis of an event evaluation.
Questionnaires
To get a more comprehensive insight into the rationale and sentiment of pedestrians, one can also use questionnaires. This method, by which people are presented by a list of questions, can be used to unravel information that cannot be uncovered via any other monitoring method. Depending on how you want to use the information, two types of questionnaires can be used, namely stated preference and stated preference.
The first method, revealed preference, establishes what a pedestrian has done in a specific situation that already took place. This type of questionnaire features questions such as ‘Which mode did you use this morning to go from your house to the station’, ‘How long did you need to cycle?’, ‘Which route did you take?’. The questionnaire aims to identify the actions that were taken. Yet, it remains difficult for people to identify why they undertook those specific actions.
The second method, stated preference, determines which choices an individual would make in a given scenario that has not yet taken place and how this choice is influenced by the available information. This measurement technique can provide insights into the rationale behind the choices that people make. A disadvantage of the technique is that there is no guarantee that the individual will make a similar choice in a real scenario. Moreover, socially undesirable answers will be less frequently vocalized in a stated preference survey. Anonymization of the questionnaire, questionnaire medium and results can help people feel secure enough to also identify these socially undesirable behaviours.
People require time to fill in questionnaires. Therefore, questionnaires do not provide information on short notice and are difficult to use in operational settings. Yet, in the run-up to a large event or in the evaluation of an event, more specific information on the behaviours and characteristics of visitors can be very helpful.
Virtual (Reality) experiments
The last technique to study the choice behaviour and operational dynamics of pedestrians is the use of computer experiments. These experiments range from the run-through of a set of pre-defined written scenarios (Dijkstra et al. 2014) to walking through a comprehensive, interactive 3D environment and soundscape featuring thousands of other visitors using a Head Mounted Device (e.g. Rio and Warren, 2014; Feng et al. 2022).
The advantage of Virtual experiments is that you can exactly determine what people see and do. Consequently, it is easier to reconstruct their information position, and as such, to better determine why people make certain choices. A second advantage is that the impact of scenarios on pedestrians that are difficult to study any other way due to ethical, financial or practical reasons. An example is the study of evacuation behaviours in buildings and complex environments.
Due to rapid advancements in this technique, and the more widespread availability of VR equipment, our expectation is that this technique will also become a more mainstream tool for pedestrian research, but also assessment of pedestrian infrastructure designs before they are actually realized.
ASSIGNMENT 8.1 – Crowd counting
A crowd counter makes a snapshot of the crowd (see Figure 1).
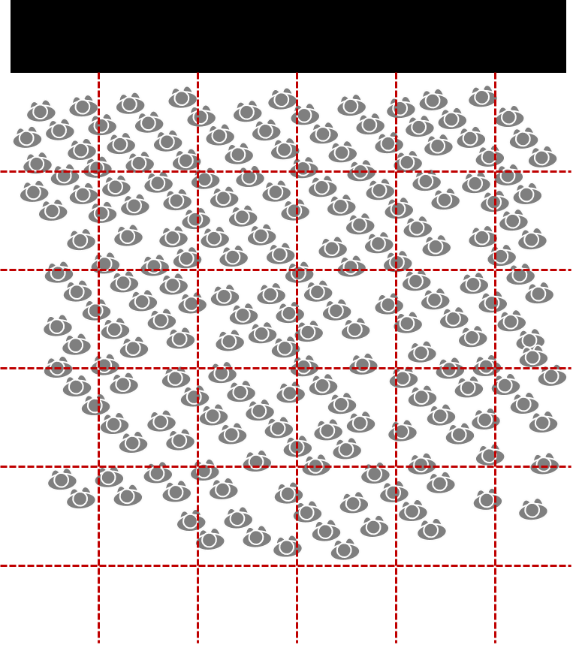
Figure 1. Snapshot of a crowd with a grid overlay
A. Determine the density of the crowd using 2 methods:
Method 1. Crowd counting style
– Randomly select 5 cells
– Count the amount of pedestrians in each selected cell
– Determine the total number of people in the area
– Determine the total density (each cell is 3x3m)
Method 2. Global density
– count all pedestrians
– Determine the global density using ρ=N/A
B. Answer the following questions
– Which method is more accurate? And why?
– which method requires more time?
– When would these two methods be most applicable?
Which monitoring technique to use when
We have constructed an overview table featuring all characteristics of each monitoring technique. For each technique Table 8.1 identifies the environment in which it can be used, which type of insights can be derived, what the expected coverage is, its potential support to operational management or offline analyses, to what extend it requires manual labour and to what extent the measurement technique generates privacy sensitive data. The cost price is not recorded, as this vary extremely based on the scenario that needs to be monitored, the required accuracy and weather conditions.
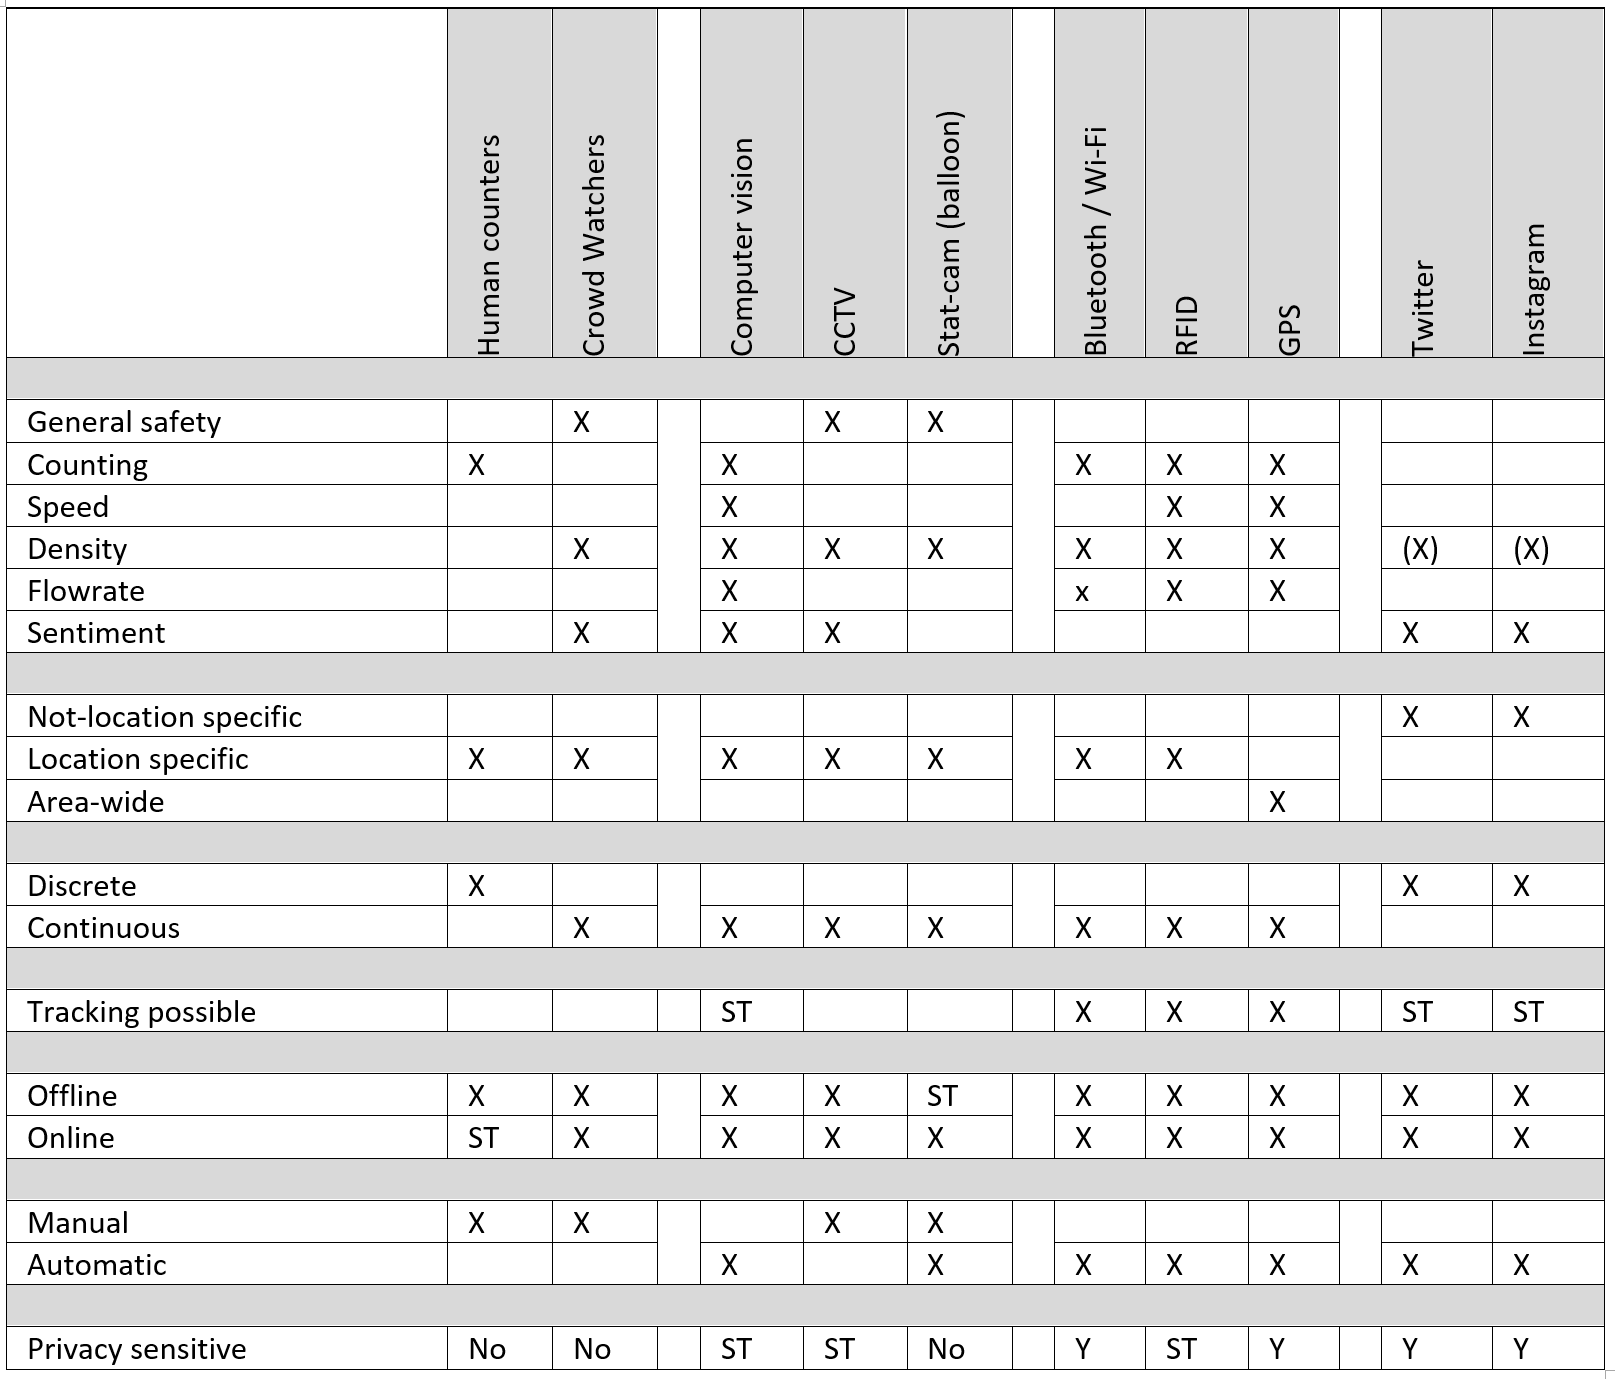
Table 1. Comparison of monitoring techniques
The table shows that the characteristics of the insights are quite diverse. Therefore, it is essential to adjust the monitoring technique to the insights that are needed. If one needs to know how flows through your network are moving, RFID and Wi-Fi are more useful, than a camera-system. While computer vision systems are more useful in case of simple flow counting.
In many cases, restrictions to safeguard the privacy of individuals, the cost price and specific measurement circumstances will govern the choice for a specific monitoring technique. Practice often sets the conditions for the monitoring technique. For instance, camera systems can only be installed when they can be deployed at the required height (often 3m or higher). Besides that, safeguarding the equipment against vandalism is an important requirement for 24/7 monitoring techniques. Also light conditions are important for most camera-based systems. Last, but certainly not least, electricity requirements can play an important role in the choice whether and where to install monitoring systems. Especially on rural terrains, electricity can be very difficult and/or expensive to organise.
ASSIGNMENT 8.2 – Which monitoring technique to use?
A. Identify which monitoring technique(s) you could use to determine the following insights:
B. For each monitoring technique, discuss how you would set up the system.
info@cityflows-projects.eu
Stevinweg 1, Delft, The Netherlands