Evaluating crowd movement dynamics
Quantifying crowd movement dynamics is a first step. Yet, in order to pro-actively manage, one needs to be able to identify when a dense crowd is safe and when the dense crowd is becoming dangerous. In order to do so, we need to be able to understand how the pedestrian traffic flow variables relate to the capacity of an infrastructure.
Fundamental diagram
Quite some years ago, a Greenshields (Greenshields, 1964) showed that there is a relation between the three fundamental traffic flow variables flow, density and speed. As mentioned before, this so-called fundamental relation of traffic engineering is:
Flowrate = density x velocity
This relation has been much researched. Figure 1 shows a sketched pedestrian fundamental diagram. This diagram shows that until a certain density, pedestrians are able to adopt their own speed, their so-called free-flow speed. As there is no hindrance, the speed and density are not correlated in the free-flow branch.
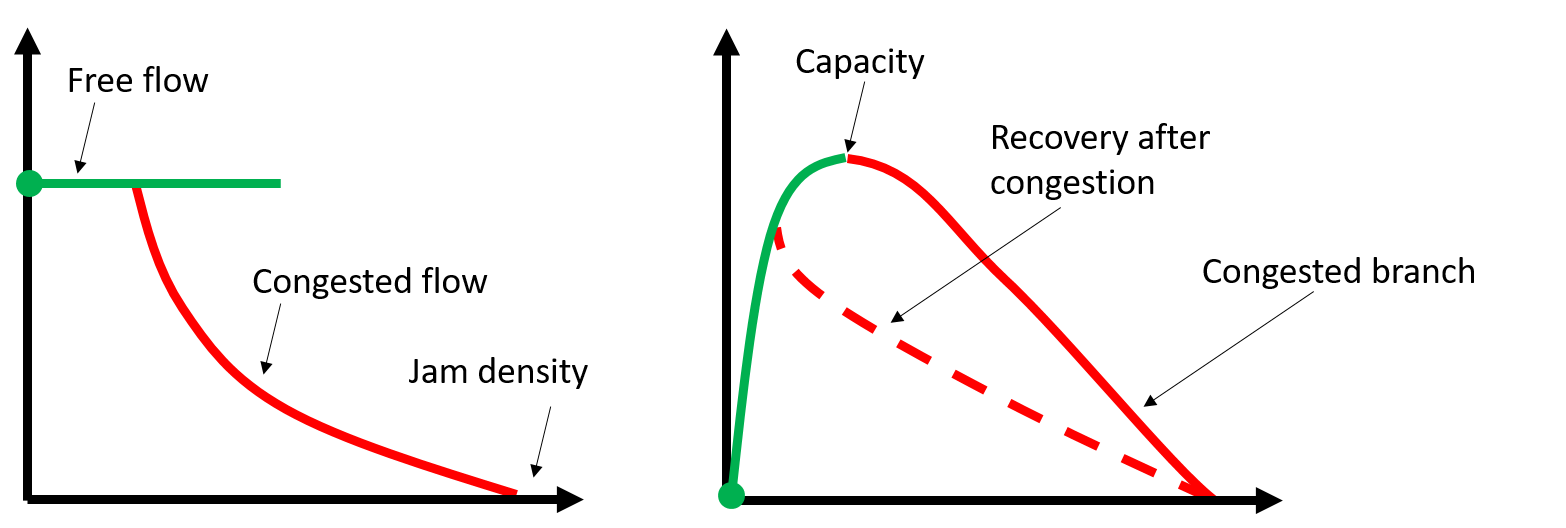
Figure 1. Visualisation of the pedestrian fundamental diagram
Yet, as for most transportation systems, the walking speed of an pedestrian is negatively related to the density experienced by that pedestrian. If the crowd becomes denser, people slow down. This inverse relation between the density and walking velocity causes a global optimum in the flow-rate graph. This maximum flow-rate value is also called the flow-rate capacity. Up to this point, higher densities lead to a higher flowrate. From this point onwards, higher densities lead to lower walking speeds and a lower flowrate.
If even more pedestrians are added to the crowd competing for the same space, it becomes so crowded that moving is not possible anymore. At this point, the jam density is reached and all pedestrians are stuck.
When the density decreases again, people get time to move and the crowd starts flowing again. Yet, in line with most traffic systems, the flowrate will, as a result of the retarded response time and hesitation of pedestrians, recover slower than one would expect. That is, after a jam arises, pedestrians shall adopt a lower walking speed at the same density, than they did before the jam arose. Therefore, the flow rate at the same density level will be lower as well. This effect is called hysteresis.
To get most pedestrians to move through a corridor, it is key to ensure the crowd dynamics do not enter the congestion branch of the fundamental diagram. This means that one needs to ensure that the density remains below the capacity point.
Because of the negative relationship between the walking speed and density, a maximum flowrate exists for any cross-section. For a corridor, the cross-section with the smallest width is called the normative capacity, and determines the capacity of the entire corridor.
ASSIGNMENT 7.1 – flow – speed relation
In figure 7.1, the relations between flowrate and density, and walking speed and density have been visualized. Construct the relation between the flowrate and walking speed based on this information.
ASSIGNMENT 7.2 – Working with the fundamental diagram
In figure 7.2, a fundamental diagram is presented for a corridor of 3 meters wide. 4000 pedestrians want to walk through this corridor.
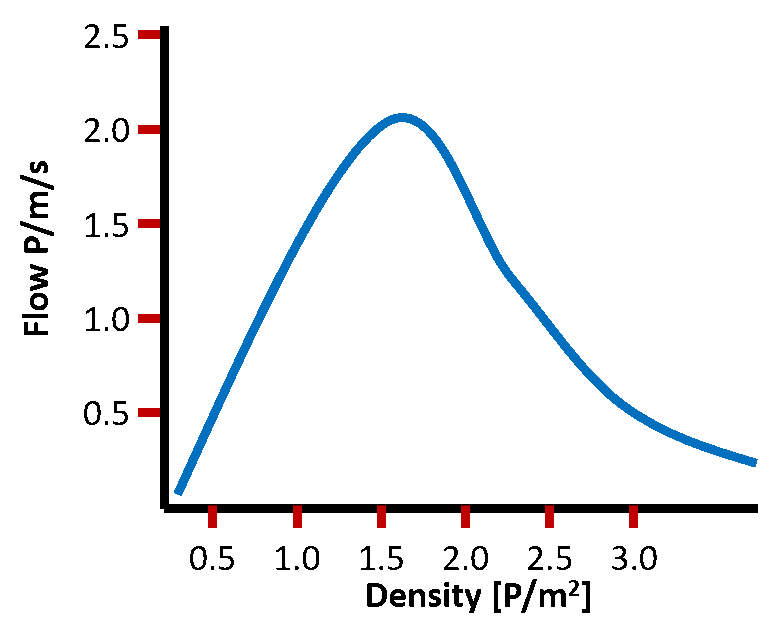
Figure 2. a fundamental diagram for a uni-directional flow in a corridor.
A. Compute how long it takes for all pedestrians to walk through the corridor if the avg. density was 1.5 P/m2.
B. Compute how long it takes for all pedestrians to walk through the corridor if the avg. density was 2.0 P/m2.
C. Explain the time difference between your answer to question 7.1.A and 7.1.B.
Factors influencing the fundamental diagram
The shape of the fundamental diagram is influenced by many characteristics of the crowd and venue. Some examples are the width of entrances, the physical and mental state of pedestrians, the desire to flee, the presence of distractions, etc. Daamen (2004) provided a nice overview of the main elements that affect the shape of the fundamental diagram. Underneath, we briefly touch upon the main factors. One is referred to the thesis of Daamen for a full overview.
Age (>18): When we get older, our physical abilities decrease. As a result, our free-flow walking speed is also decreasing in relation to the density. Consequently, the slope of the fundamental diagram decreases as well.
Culture: Some cultures value personal distance more than others do. Research shows that the slope of the free-flow branch is steeper and the flowrate capacity is higher in Asian countries than in European countries. For other parts of the world, this is not clear yet, as most research is performed in those two continents.
Gender: The physical abilities of men and woman differ. One of the consequences is that the free-flow walking speed of men is slightly higher than that of women. Moreover, they are generally longer, so they have more oversight. Thus, the slope of the fundamental diagram is steeper for men than women.
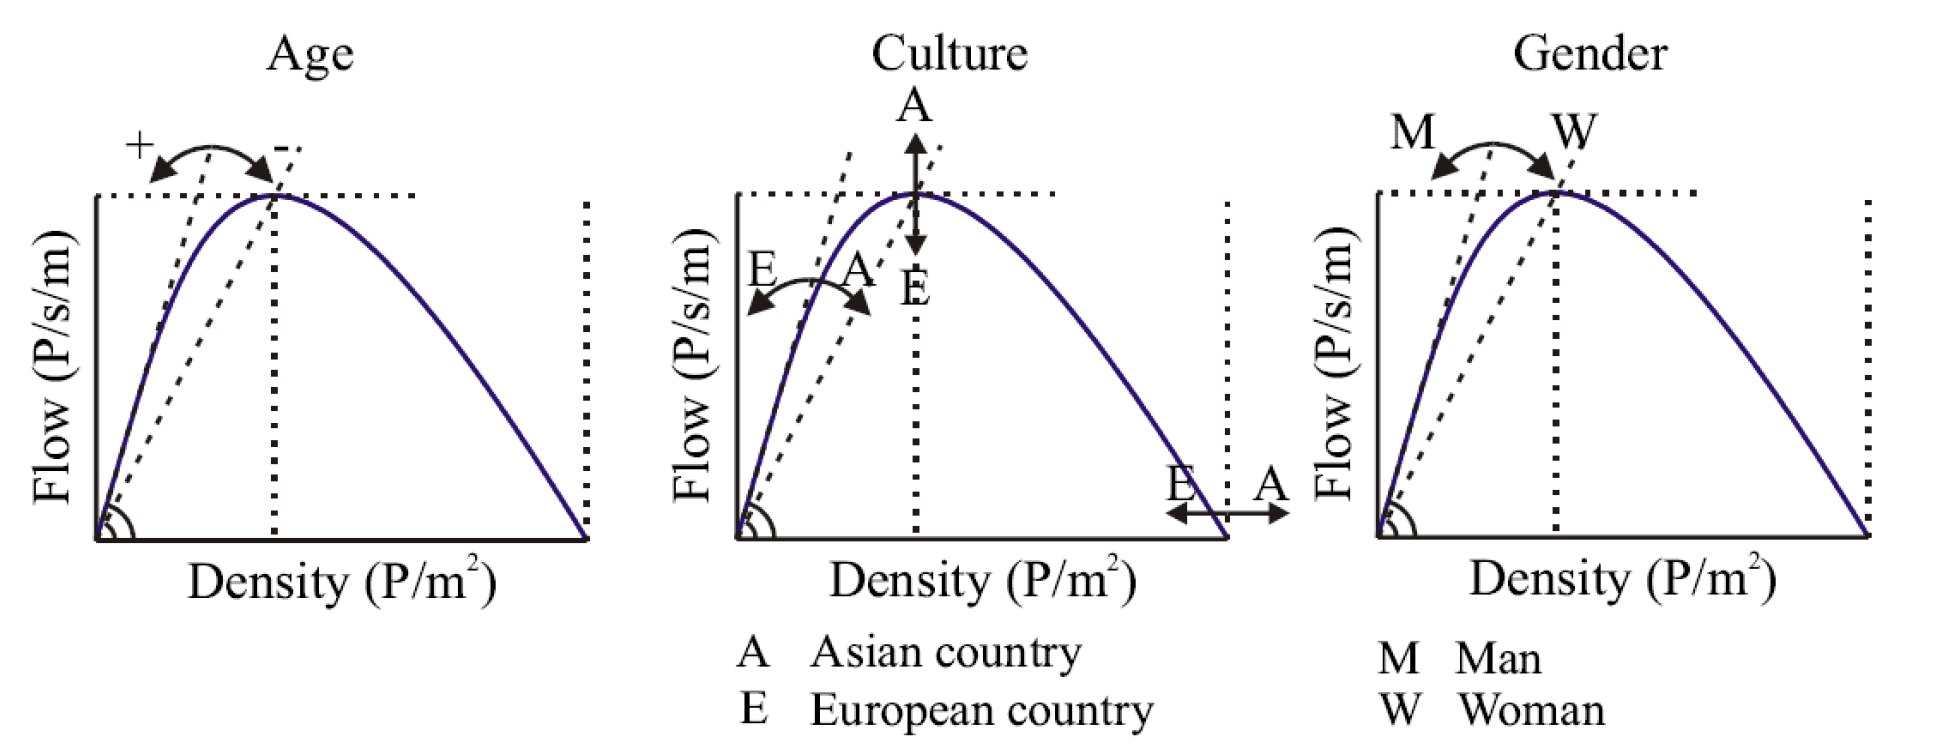
Figure 3. Impact of age, culture and gender on the pedestrian fundamental diagram
Shy away distance: Pedestrians attempt to keep distance to obstacles around them. Various studies indicate that the shy away distance varies with the type of surface (e.g. Weidman (1993), De Neufville & Grillot (1982)). As this distance needs to be discounted in the density, a large shy away density leads to a effectively at a lower walking speed at a lower density level. Thus decreasing the slope of the free-flow branch of the fundamental diagram.
Temperature: Also, temperature is known to influence the walking speed of pedestrians. Weidman (1993) finds that the walking speed decreases with higher temperatures (>25 °C), and increases with lower than normal temperatures (>0 °C). Here, the reference is set at 15 °C. This means that for events during warm days, walking speeds will decrease earlier than expected for a given density and the flowrate capacity will decrease as well.
Travel purpose: The goal orientation (also called travel purpose) of people is also found to influence the walking speed. Pedestrians on work related travel (i.e. commuting traffic, businessmen at airports) are found to walk faster than people performing leisure activities do. This means that in stations the slope of the free-flow branch increases.
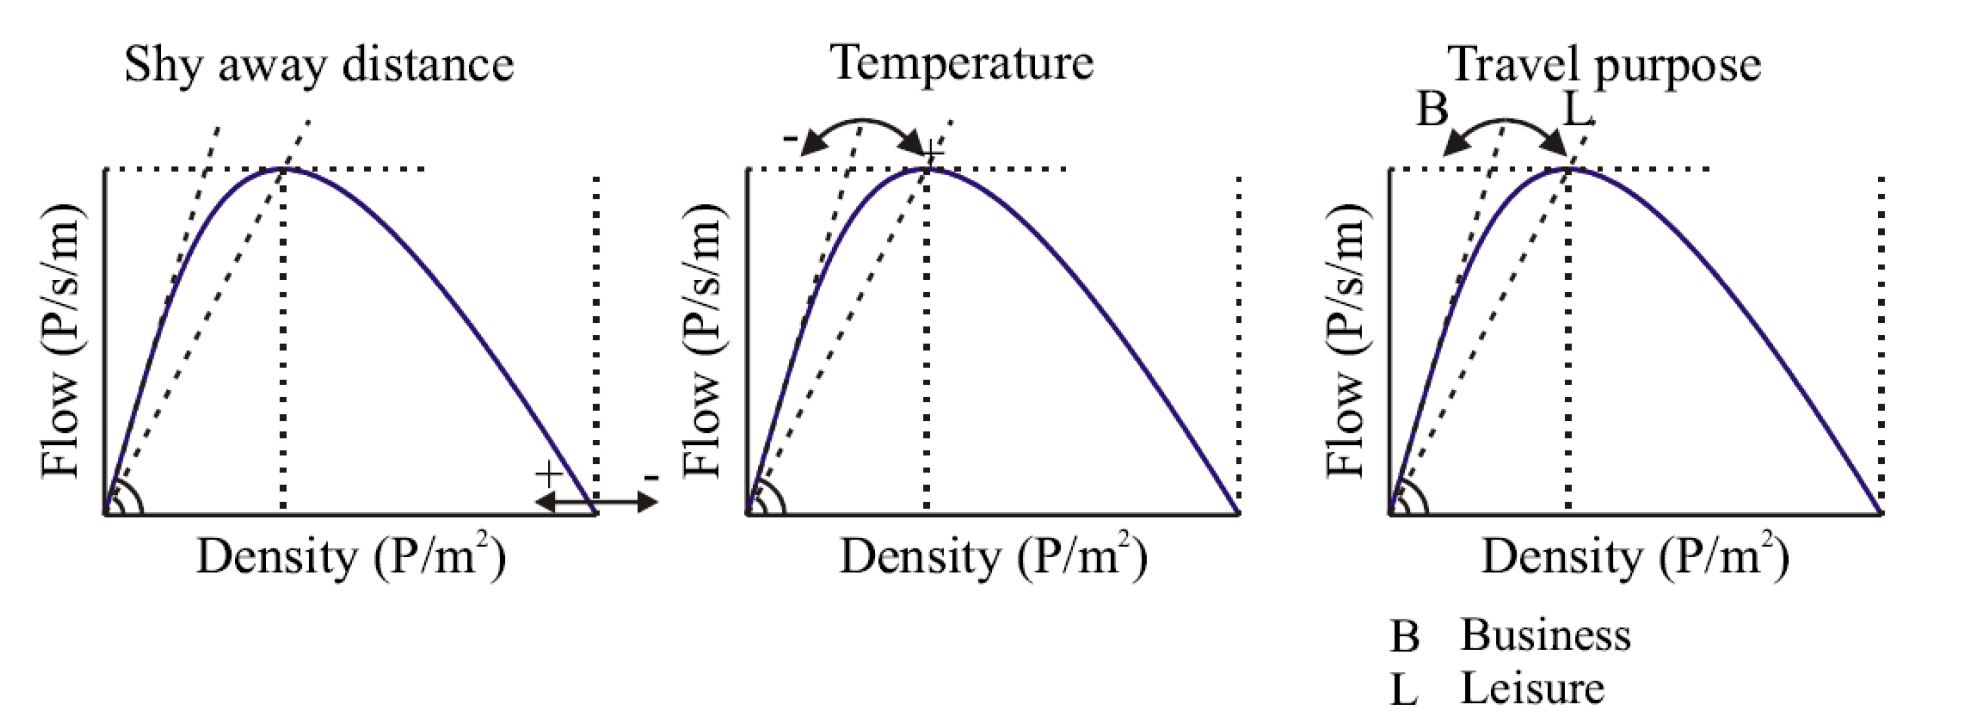
Figure 4. Impact of shy away distance, temperature and travel purpose on the pedestrian fundamental diagram
ASSIGNMENT 7.3 – changes in the fundamental diagram
In figure 5, a fundamental is depicted. Use the letters in this fundamental diagram to identify what changes occur. Identify how the fundamental diagram for the following cases differs from the generic fundamental diagram for an average population.
A. An elderly home
B. A spectator crowd for a soccer match
C. A marathon (the runners)
D. A shopping street
E. A theme park like the Efteling
F. A music event, late at night.
G. A hot summer afternoon
H. An airport near a large business district
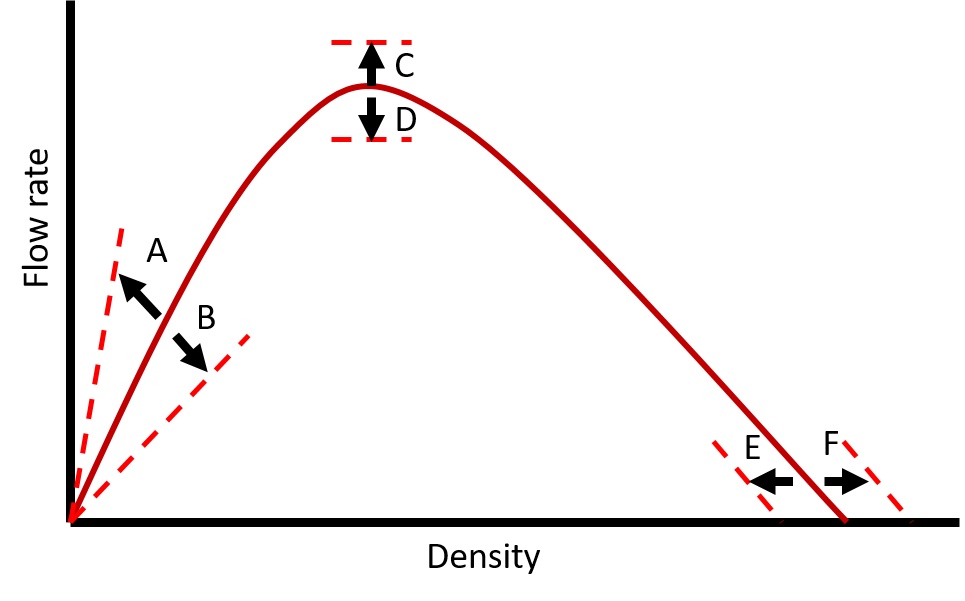
Figure 5. Example pedestrian fundamental diagram
Fruin’s Level-of-Service
What does the value for density actually mean? When we use the inverse of the density, namely average area per person, we might be able to better understand what increasing densities mean for pedestrians. This average area is often used to express the Level of Service (LOS) of a facility.
Fruin (1971) was the first to make this translation. He came up with a Level of Service framework for the London Underground. Six levels were defined, being:
These levels are still used often by crowd professionals to identify whether and where issues occur in pedestrian infrastructures. Often the aim is to ensure that the maximum LOS in the infrastructure does rise past LOS D.
ASSIGNMENT 7.4 – Awareness
In most experimental settings, densities up to 5.4 P/m2 have been recorded. Also during events, crowds can reach similar densities. At the Jamarat Bridge, Helbing’s team even recorded densities up to 10 P/m2. To really understand what these densities mean, we would like you to perform the following exercise.
Step 1: Draw/create a square of 1 m2 on the floor
Step 2: Stand in the square. If you only had the free space in the square available, this would be LOS D.
Step 3: Ask one of your colleagues, friends or family members to join. This is LOS E
Step 4: Now try to fit at least 5 people in the square.
Step 5: Imagine that you need to fit another 5 people in the same square. Under what circumstances would that work?
A. Write down what you experienced during this process.
B. Reflect on how your experience would change in the density levels in steps 3 – 5 when you know you would need to stand there for 30 minutes. Pay special attention to emotions and your own display of physical behaviours in your answer.
Other Level of Service principles
The experienced Level of Service is partly subjective, and impacted by many things. For instance, the weather, the light conditions, the population and the time spend in a dense crowd.
In the LOS definition of Fruin, these factors have not been discounted. As you can imagine, spending 1 second is a very dense crowd is more acceptable to pedestrians, than spending 30 minutes in that same crowd. Similarly, the type of crowd also has in recent years, several concepts have been presented that discounts for some of these factors. Yet, a new, more comprehensive definition of Level of Service is still pending.

info@cityflows-projects.eu
Stevinweg 1, Delft, The Netherlands
