Crowd movement dynamics fundamentals
The result of people’s choices is that they walk in a space at a certain time. The combination of decisions of a lots of individuals results in a crowd that is on the move. Whether this crowd is going to fit in the infrastructure is dependent on their operational behaviour. Consequently, crowd professionals and building engineers have from the beginning been very interested in the movement dynamics of the crowd. The idea is that when one understands the resulting dynamics, one can better understand which scenarios will be a potential cause of concern
Quantifying movement dynamics
The movement behaviour of a crowd can be studied at two levels. At the microscopic level, one can study the movement dynamics of one specific individual. At the macroscopic level, we study the movement dynamics of the entire crowd. As you can imagine, we use different variables to study the microscopic operational dynamics and the macroscopic dynamics of a crowd. We first present the microscopic traffic flow variables. Accordingly, the macroscopic traffic flow variables are presented.
Microscopic movement dynamics
At the microscopic level, we analyse the movements of one individual in relation to all elements in its surrounding. Often three microscopic traffic flow variables are used to describe the movements of an individual, namely:
Velocity: a measure of how fast a pedestrian moves in a particular direction (see blue arrow in figure 6.1). Please note that velocity is a vector, and has both a magnitude (also called speed) and a direction. This means that the velocity is always related to a specific frame of reference. The microscopic velocity can be computed as follows:
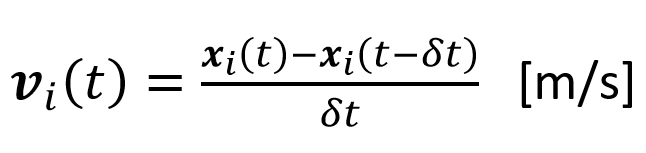
(1)
Where v_i (t) is the velocity of pedestrian i at time t, x_i (t) is the location of pedestrian i at a given time t and δt is a brief time interval.
Acceleration: a measure of how fast the velocity changes. Consequently, the acceleration is a derivative of its velocity. In addition, the acceleration is a vector, and has both a magnitude and direction. The microscopic acceleration can be computed as follows:
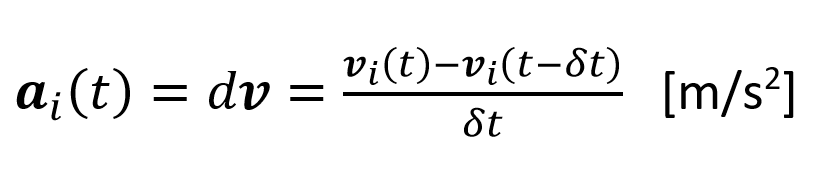
(2)
Where a_i (t) is the acceleration of pedestrian i at time t.
Distance headway: a measure of the distance between two moving pedestrians or objects at one specific point in time (see the green arrow in figure 6.1. The distance headway between two pedestrians i and j, named s_(i,j)(t), can be computed as follows:
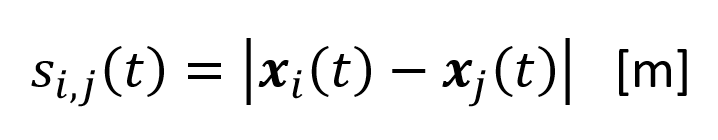
(3)
Please note, the distance headway is always a positive value, as it is the square-root of the difference between the location vectors of pedestrians i and j.
Time headway: a measure of the time interval between two moving pedestrians at one specific point in time. Under the assumption that all pedestrians keep moving at their current pace, and are directly behind each other, you can compute the time headway as follows:
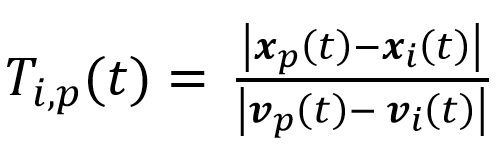
(4)
Where T_(i,p) (t) is the time headway is the division of the current distance headway and the closing speed between pedestrians i and p.
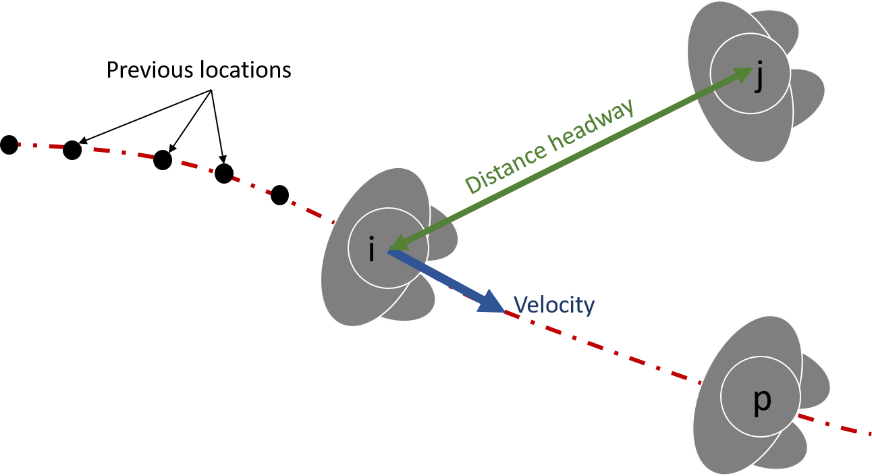
Figure 6.1. Visualisation of microscopic movement variables
Macroscopic movement variables
At a level of the crowd, we make use of three different variables, namely space-mean velocity, density and flow.
Space-mean velocity: a measure for the average speed and direction in a given area (see figure 6.2). This measure also features both a magnitude (V_c (t) – a.k.a. space mean speed) and a direction (γ_c (t)). Both features are computes as follows:
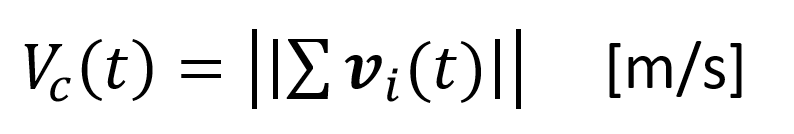
(5)
Please note, the space-mean speed is a scalar, while the direction is a vector.
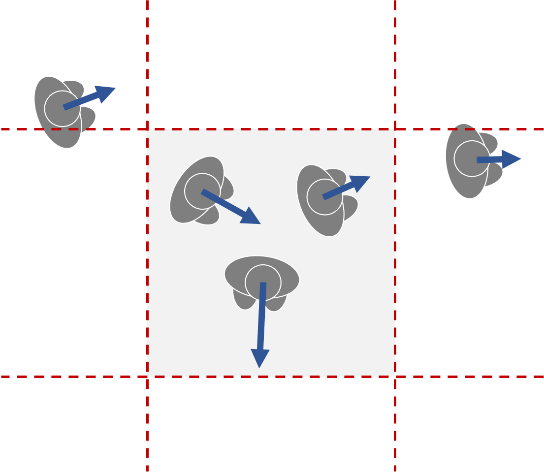
Figure 6.2. Visualisation of the space-mean velocity
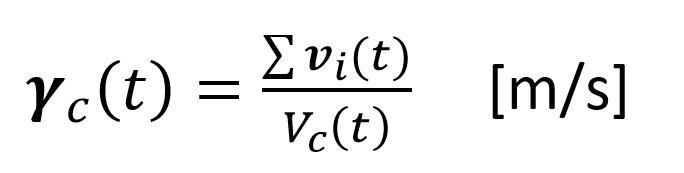
(6)
Density: a measure for the number of pedestrians that stands within a specific area (often 1 m2). There are many different methods to derive the density of a region. Here, we will adopt the one that is most used by crowd professionals, as it is fastest to compute:
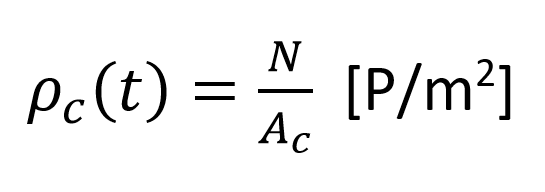
(7)
Here, the density of an area c is defined as the number of individuals in the area divided by the total surface of the area. Especially when discussing crowding issues, density is one of the main metrics that is evaluated.
Flow-rate: a measure for the number of pedestrians that moves across a specific cross-section. Flow is computed as follows:
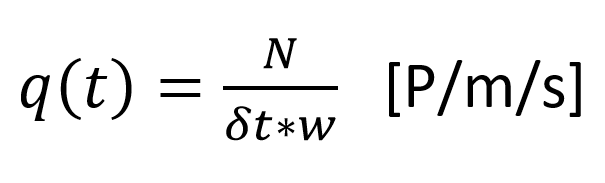
(8)
Here, the flow is computed as the number of individuals that passed the cross-section divided by the time interval needed to do so. Often the flow-rate is normalized by dividing the flow also by the width of the cross-section w.
Relation between pedestrian traffic flow variables
In car traffic theory (1-dimensional), two relations between the traffic flow variables have been established for homogeneous and stationary car-traffic.
1. the flow-rate and the average headway are related via q = 1/ average headway
2. the flow-rate, density and velocity are related via flow (q) = velocity (v) * density (rho)
Research have proven that these relations also hold for pedestrian crowd movements. Yet, to transfer from 1D to 2D, the flow and velocity in the second relation become vectors with a magnitude and direction instead of a scalar.
Why is this of importance? Because we can use these relations to derive state variables that we do know from variables that we do know. As you will see in the section on measuring crowd dynamics, it is difficult to measure all necessary information. Yet, if you can estimate some properties, you can fill in the others.
Movement base cases
Besides studying the crowd movements in a quantitative fashion. A lot of information can also be derived from the overall phenomena that we observe in crowds. To do so, we first need to distinguish between the types of flow scenarios that can appear in a crowd. Duives et al. (2013) has developed a taxonomy of crowd movements, which serves this purpose nicely.
This taxonomy identifies 8 distinct movement base cases. The motion cases have been chosen in a way that only one action is present within each situation. Furthermore, the movement base cases jointly cover the whole range of pedestrian movement behaviour.
First, a distinction can be made between uni-directional and multidirectional flows. Where in the first group mainly uni-lateral interaction is found, the behaviour in the second group is also influenced by bi-lateral interaction (i.e. collision avoidance) (Versluis, 2010). Uni-directional flows can either be straight flows (A – no changes in available space or changes in direction), flows rounding corners (B), flows entering a bottleneck (C) or flows exiting a bottleneck (D). Multi-directional flows can be either parallel or intersection under an angle. In parallel, flows bi-directional straight flows can occur (E). In the latter case, intersecting flows, the exact movement pattern depends heavily on the available space and the number of flows present at the intersection. The interaction of the streams might cause a random crossing situation (H), where many consecutive 2-person crossings will happen shortly after each other or the situation where the pedestrians intersect at a focal point. Depending on the number of flows intersecting at the focal point, distinct types of behaviour emerge. Two (F) or more-directional flows (G) are therefore separately assessed in the comparison of the models.
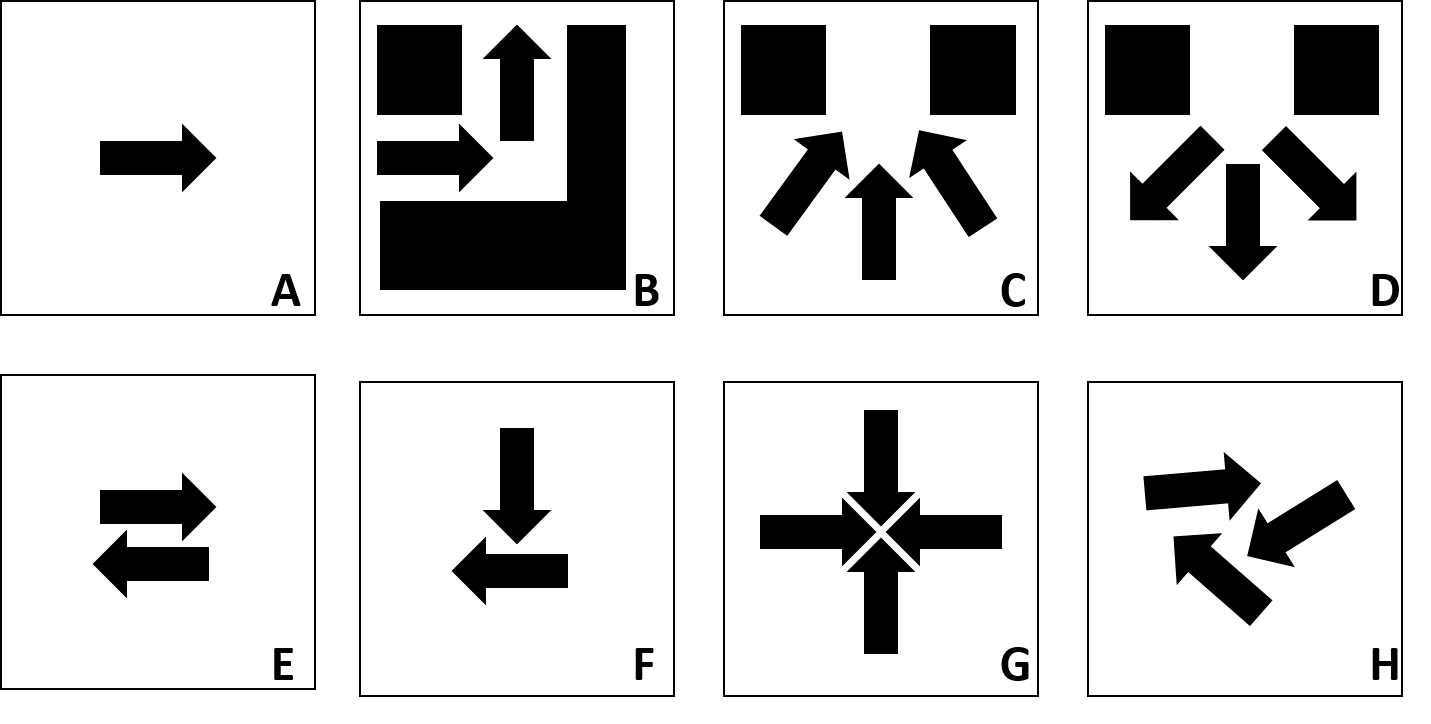
Figure 6.3. Movement base cases. A = uni-directional straight, B = rounding a corner, C = merging, D = expanding, E = bi-directional straight, F = focussed 90degree intersection, G = focussed four-directional 90degree intersection, H = random.
Crowd movement phenomena
When you bring lots of individuals together in one place, a magical thing happens. Even though, pedestrians do not actively seek to organize themselves, organisation automatically occurs. This is self-organisation, which is defined as the spontaneous establishment of qualitatively new behaviour through the non-linear interaction of many objects or subjects (Helbing and Johansson, 2010) without the intervention of external influences (Camazine et al., 2020). Many biological species have this capability.
In literature, seven types of crowd self-organization phenomena have been mentioned for pedestrian crowds. The most common self-organization movement described by scientist is lane formation. During this process, a number of lanes of varying width form dynamically in a corridor that features a bi-directional straight movement base case. The width and number of lanes is dependent on the size of the corridor. In small corridors, often just two lines separate. Duives et al. (2012) recorded a large number of lanes in case of wide corridors on festival grounds. As friction between the two flow directions only occurs at the boundary between the lanes, the general efficiency of the crowd flow increases and the need for complex interactions decreases for all individuals involved.
In focussed intersecting scenarios with two flow directions, a second self-organisation phenomena is seen, namely block formation. To limit the friction, the two dominant flows both break up into smaller groups of individual that jointly cross the other flow. Often, one individual acts like a beachhead, and the others follow in this persons wake. Also this phenomena, is known to improve the efficiency of the crowd flow.
In a denser uni-directional movement base case, Helbing et al. (2007) also found Stop&Go waves, which are temporarily interrupted longitudinally flows that appear at higher densities in uni-directional crowds. Until that moment, we had only seen similar waves in vehicular traffic. These waves are a signal that the crowd flow is getting unstable. As such, for crowd professionals, Stop&Go waves are an indication that additional measurements are necessary.
In an even more dense flow regime, the same group established the existence of turbulent flows. Pedestrians have no control over their own movements anymore. This phenomenon can be really dangerous, as people are latterly lifted out of their shoes. If one falls, there is little opportunity to come back up. In this scenario, also local force-based interactions between pedestrian bodies are seen, resulting in pressure waves that can move through the crowd (e.g. Krausz and Bauckhage, 2012).
Two other effects have been described at an operational level in- and around bottlenecks, namely the zipper effect (Hoogendoorn and Daamen, 2005) and the Faster-is-Slower effect (Helbing and Johansson, 2010). The zipper effect describes the situation in which pedestrians allow temporarily others within the space diagonally in front of them, in order to fit more people through a corridor at the same time. This effect is only established for very narrow and short corridors. The third effect (Faster-is-Slower) describes a situation where the density in a queue upstream of a bottleneck builds because people keep moving forward while the entrance is clogged. The higher densities cause coordination problems, since a large number of individuals are competing for a few small gaps. The resulting bodily interaction and friction slow down the total crowd. As such, under slights low densities, actually more people make it through the bottleneck in the same amount of time.
The last interesting crowd phenomena is also described by Helbing et al. 2005. Herding describes the case where in ambiguous situation individuals tend to follow other individuals instead of taking the most optimal route. For crowd professionals, this behaviour is especially of interest, as it is predominantly recorded to happen under stressful evacuation situations.
ASSIGNMENT 6.1 – flow rate
A crowd of pedestrians is walking with an average speed of 0.9 m/s through a corridor. The crowd’s density is 0.5 P/m2. What is the average throughput (flow rate) of the corridor?
ASSIGNMENT 6.2 – headway
A single line of pedestrians is walking through a gate. The flowrate is 90 pedestrians per minute. What is the average headway between the pedestrians?
info@cityflows-projects.eu
Stevinweg 1, Delft, The Netherlands